
Numbered plots you can find again
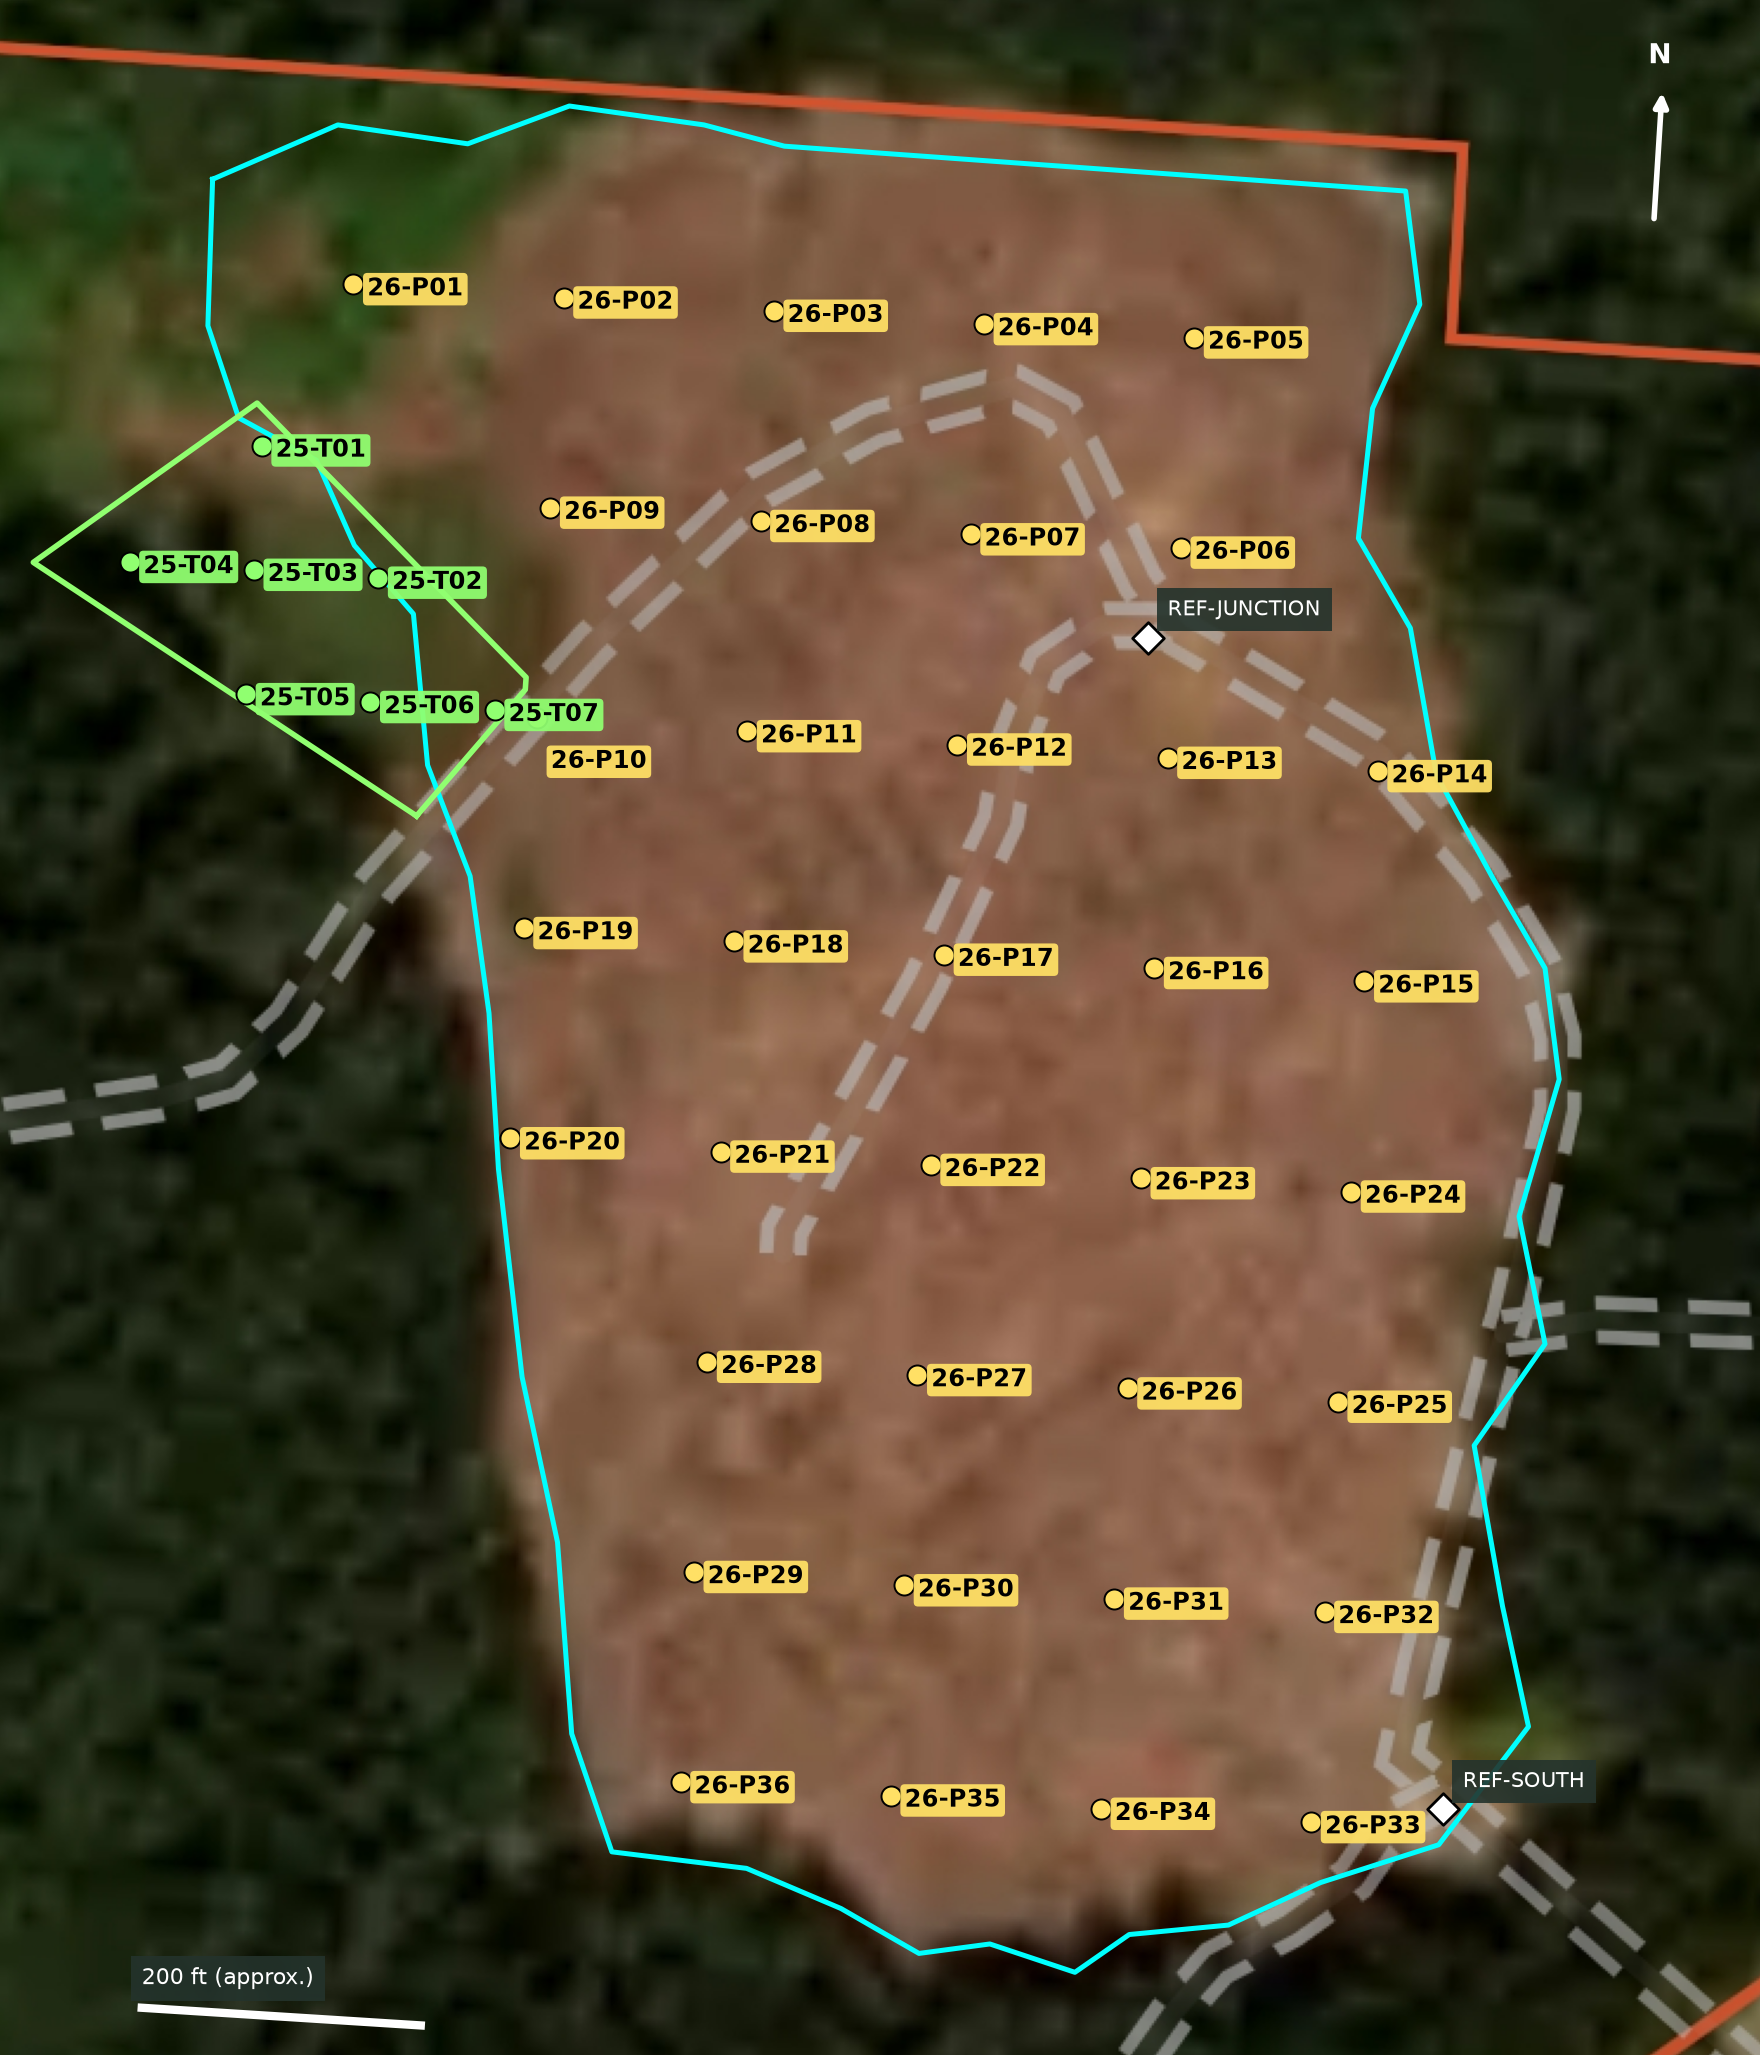
For Dave and Eli: 36 plots for the 2026 planting and 7 for the 2025 trial, with matching map labels, GPS coordinates and count sheets. Keep the two planting years separate when recording and reporting results.
Which program to use
Use the KraemerTower field app to find plots and enter counts together. Install it in Android Chrome, finish offline setup, and save a full backup at the end of each outing. It uses these same 43 locations and keeps the two planting years separate. The phone guide explains setup and sharing.
Keep onX as a familiar map companion, and use Google Earth to review the layout. The same coordinates work in all three. onX supports downloaded maps and GPS location without cell service, while Google Earth accepts the prepared KML for reviewing the boundary and plot layout. There is no need to add another mapping subscription to try this workflow. onX location guidance · Google Earth KML guidance.
An app change alone does not improve the phone’s GPS receiver. A labeled stake or flag makes the center repeatable; a tape defines the plot radius. If this becomes a recurring inventory with integrated forms or an external precision receiver, QField is an option to evaluate then. QField positioning documentation.
Load one copy of the layout
- onX, complete review map: download KT-Survey-2026-09-08-A-REVIEW.kml, then use the onX web map’s My Content → Import and select Import map data to a new folder. The file contains 47 items: 43 sample centers, two approximate road references and two working boundary shapes. Name the folder KT Survey 2026-09-08-A REVIEW. Do not import the point-only file as well.
- onX phone or another GPS app, points only: use the 43-plot GPX. The two road-reference points are a separate optional import; they are not sample plots.
- Google Earth: open the plots-and-boundaries KML. It contains the same 43 plot centers and a historical planned-harvest comparison layer, hidden by default.
- Recording: use the field app, PDF, CSV register, or 43 phone-note blocks. Counts start blank. Use the same plot ID in every note and photograph.
Importing the same points twice creates confusion. Check existing folders before importing. Each person must download an offline map to their own phone, then test the map, labels and location in airplane mode with location services enabled. onX import/export instructions · offline-map instructions.
Find and establish a center
-
Check the two road references and planting edges. REF-JUNCTION and REF-SOUTH identify visible road junctions; they are approximate aids, not surveyed controls. If the map seems consistently shifted, record the mismatch and correct the alignment before counting.
-
Select a plot and use Go-To Waypoint. Follow a safe route. The numbering alternates along rows to make the list easier to follow; it does not establish safe paths through slash or across slopes.
-
Mark the center before evaluating nearby trees. Let the GPS settle, record its accuracy if available, and label a stake or flag. Preserve the planned point and save the actual marked center separately, such as 26-P01-A. Record any offset. Do not shift toward surviving trees or an easier place to stand.
-
Measure 16.65 feet horizontally with a tape. That defines a full 1/50-acre circle. The phone locates the neighborhood; it cannot reliably define this small circle. Use the counting instructions for rooted stems, multiple shoots and uncertain trees.
-
Record the correct planting year. A completed zero-tree plot is a zero. An unsafe, unvisited, unplanted or partial-edge plot needs its own status. Resolve partial-plot area and edge treatment before applying a density estimate. Keep failed planting patches in the sample.
Why 36 plus 7?
The main grid has about 151-foot spacing, targeting roughly 40 centers. Its single random offset produced 36 centers inside the working outline; all were retained. The separate trial grid has about 89-foot spacing, targeting six and producing seven centers. Points near boundaries were retained for field review. The grids were set without using seedling survival to choose locations.
These IDs replace the earlier provisional P01–P40 picture for this new layout. Preserve IDs and the original grid when resolving exclusions. If a boundary materially changes, save a new version and have the sampling layout reviewed before mixing records from different versions.
For the small 2025 trial, consider counting every tree if the planting rows can be followed. Approximately 300 were reportedly planted. That complete count may be more informative than the seven-plot sample; report it separately from the 2026 estimate.
What the map establishes—and what remains to check
Eli’s September 8 email image displays an August 3–17, 2026 imagery interval. Dave directed that this image take precedence over his historical “2025 Harvest” shape. Three parcel-line corners from the original onX KML provide coordinate references. The KML itself contains the old harvest, trial and parcel shapes; it is not an export of a newly traced clearcut.
The traced clearing is approximately 21.1 acres, or 20.8 working acres after removing its overlap with the saved trial outline. The saved trial is approximately 1.1 acres. These are approximate map areas before resolving planting exclusions. They are not confirmed net planting acres and must not be used yet to announce whole-area survival.
Six decimal places preserve the waypoint coordinates between files; they do not imply inch-level ground accuracy. Imagery, parcel alignment, edge interpretation and phone GPS each contribute uncertainty. The original image and KML are preserved in the project. No field counts have been entered.
When counts are complete, use the replacement-planning guide with confirmed acreage and the actual planted tally for each year.